Infectious diseases, like malaria, travel where we travel. This spread of disease can be deadly, with an estimated 445,000 malaria-related deaths worldwide in 2016. While mosquitos cannot travel long distances, we can. Further, malaria does not spread only from mosquito to human, but also from human to mosquito. This means that long distance travel can re-introduce malaria to areas in which the disease has already been eradicated.
Public health officials must understand patterns of human mobility to effectively plan prevention and intervention campaigns. At Dalberg Data Insights, we serve public health officials by assessing big data to understand patterns of human mobility. This data can tell us where people live, where they travel, and how they go from one place to another. By combining this information with malaria incidence data, we map malaria risk flows, aiding public health officials to more efficiently create and maintain malaria-free zones.
Armed with the technology and know-how to fill the data gap in malaria prevention and intervention, we have partnered with MACEPA PATH and the National Malaria Elimination Centre in Zambia to create an interactive tool that maps the potential spread of malaria across the country.
Our Partners: The National Malaria Elimination Centre and MACEPA PATH in Zambia
The National Malaria Elimination Centre (NMEC) works with many partners to create malaria-free zones in Zambia. The Ministry leads the charge against malaria by combining an innovative spectrum of interventions and data for decision making, ranging from preventative vector control tools to advancements in diagnostic sensitivity, new drugs, and rapid and accurate reporting systems. PATH MACEPA supports the Ministry with the introduction of innovative interventions, data mining, and operational research to track the pathway forward.
The Ministry of Health projected that in 2004, 50 percent of people in Kazangula District would suffer from malaria at some point during the year. After the introduction of a combination of interventions, community surveillance, and data analytic tools, including “trac[ing] people who had contact with infected individuals”, malaria incidence in the same district in 2014 dropped to 5 new cases out of every 1000 people.
An important strategy toward the elimination of malaria in Zambia, then, is mapping human mobility to allow health officials to trace the relationship between day-to-day human mobility and the spread of malaria across the country. This mobility information is essential for elimination, where in many areas in Southern Zambia malaria is close to eliminated and malaria-free zones must be protected from the re-introduction of the disease.
Prior to our collaboration, NMEC’s strategy faced several challenges related to its mobility data
- NMEC did not have access to a centralized and systemic data on human mobility
- NMEC and PATH MACEPA’s only source of mobility information was malaria patients’ self-reported trip records from surveys and routine reports, which often do not provide sufficient detail on a timely basis to make decisions.
- District health officials did not know whether malaria was being exported from other districts to their area.
What We Built: Malaria Surveillance Tool
To answer the Ministry of Health and PATH MACEPA’s specific set of challenges, we built an interactive tool that traces patterns of human mobility based on previous scientific research. Using anonymous, aggregated data from millions of people, our tool mapped malaria risk flows. During its pilot phase, the tool connected to a stream of data, ensuring that the mobility insights were up-to-date.
The tool provides the Ministry and PATH MACEPA with three maps, each built to answer a question identified by PATH as essential to their decision-making process:
• How are different malaria regions interconnected?
• Which areas should eliminate malaria first?
• What are the main malaria imports and exporters for each district?
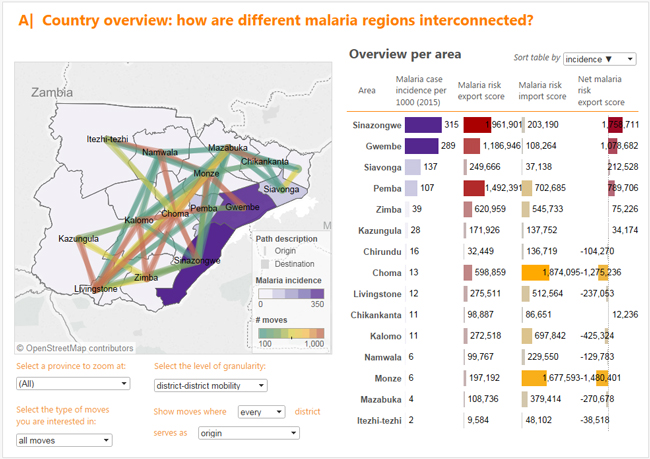
With just a few clicks the user can discover how areas with different incidence rates are interconnected and which areas serve as the main transmission hubs, can maximize malaria elimination by uncovering priority areas that would most effectively interrupt national malaria flows, and can highlight which regions should coordinate their interventions based on regional mobility patterns and inter-regional rates of malaria imports and exports.
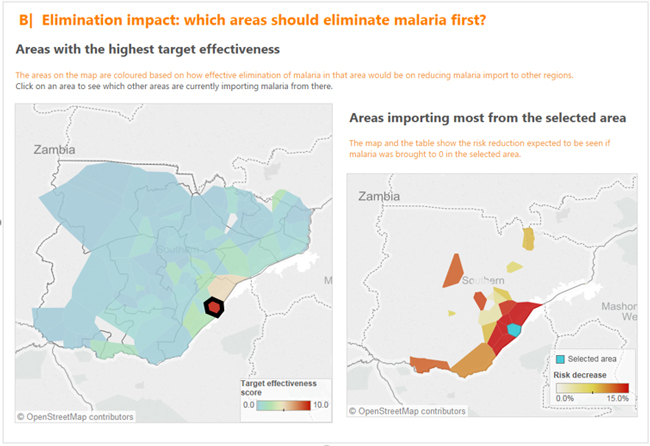
The elimination impact map is easy-to-use and color-coded to illustrate to the user how the elimination of malaria in one area would reduce its importation into other areas. This map helped the Ministry of Health and PATH MACEPA prioritize areas of elimination to optimize the impact of their intervention strategy in the southern regions of Zambia and efficiently expand into the country’s western provinces.
The Results:
Thanks to our tool, district health officials in Zambia can now:
• accurately prioritize areas for more effective and better targeted interventions and preventive campaigns to account for the burden of malaria importation
• better understand the malaria risk imports and exports between individual districts
• coordinate actions between different districts for the highest malaria elimination efficiency
Already, our tool has provided the National Malaria Elimination Centre and PATH MACEPA with the evidence to determine more appropriate areas to continue the roll out of elimination planning.