


Dalberg uses cookies and related technologies to improve the way the site functions. A cookie is a text file that is stored on your device. We use these text files for functionality such as to analyze our traffic or to personalize content. You can easily control how we use cookies on your device by adjusting the settings below, and you may also change those settings at any time by visiting our privacy policy page.

Today, over 50% of the global population lives in urban centers, and this proportion is projected to climb to 66% by 2050. This population surge will predominately occur in developing countries with poor infrastructure, where cities already struggle to meet their inhabitants’ mobility needs. The next 30 years will challenge their existing road network, public transportation systems, and emergency response strategies. It is critical for authorities to anticipate this urban growth and redesign their current infrastructure to ensure the sustainable development of their cities.
Sustainable urban development depends on accurate mobility predictions to design infrastructure and organize efficient emergency management. In developing countries, it is difficult to gather the representative data necessary to set a successful urban planning agenda. Generally, the only data available to map commutes come from census data or surveys, which have several limitations:
- Surveys are conducted every five to ten years, so census data can be up to a decade old.
- Surveys are expensive to conduct.
- Surveys rely on small samples rather than large parts of the population.
Furthermore, traditional traffic data collection requires specific infrastructure or staff, resulting in overall limited oversight on the mobility of a city.
To help urban planners and city officials make better policy decisions, Dalberg Data Insights analyzes telecom and traffic sensor data to map commuter travel patterns: origin-destination trips and average trip durations. By providing comprehensive and up-to-date mobility information to policy makers and city planners, these officials can better promote inclusive, equitable, and sustainable development in their local contexts.
What We Built: Mobility Analytics Manager
In response to the need for sustainable urbanization, Dalberg Data Insights has created the Mobility Analytics Manager, a solution to analyze and predict mobility patterns in fast growing cities. By anonymizing and aggregating the mobile phone transactions of millions of people, we can understand where those people live, work, and how they commute from A to B. With this information, we can then map the most popular commuter routes and areas of congestion.
We co-designed the first version of the solution with ROM Transportation Engineering, an urban planning consultant firm, and the Kampala Capital City Authority in support the Transportation Master Plan for Greater Kampala Metropolitan Area. The tool measured the average mobility patterns in and around the city of Kampala for different time periods in the day and in the week. The development of the analytics tool was supported by the United Nations Capital Development Fund and the Belgian Development Cooperation.
After the first successful implementation of the solution, we scaled it for the Inter-American Development Bank (IDB) and the Haitian authorities. The tool provided them with a comprehensive overview of mobility in Haiti on business days, Saturdays, and Sundays between the country’s communes. Within the capital city of Port-au-Prince, the tool provides a further deep analysis of urban commuting patterns measured at cell phone tower level.
The tools provide users with crucial insights necessary for the optimization of the transportation network in the country. This includes the following fact-based insights:
- Origin-Destination Flows: How many trips (inbound and outbound) is a specific neighborhood generating over time? Which destination attracts the most people? From which place are the most people departing?
- Travel Path Estimation: What is the origin neighborhood of inbound trips and what is the destination neighborhood of outbound trips? What are the most popular commuting trips?
- Travel Time Estimation: What is the average travel time between two neighborhoods?
- Distribution Flow: How are the commuters spread over time between two areas?
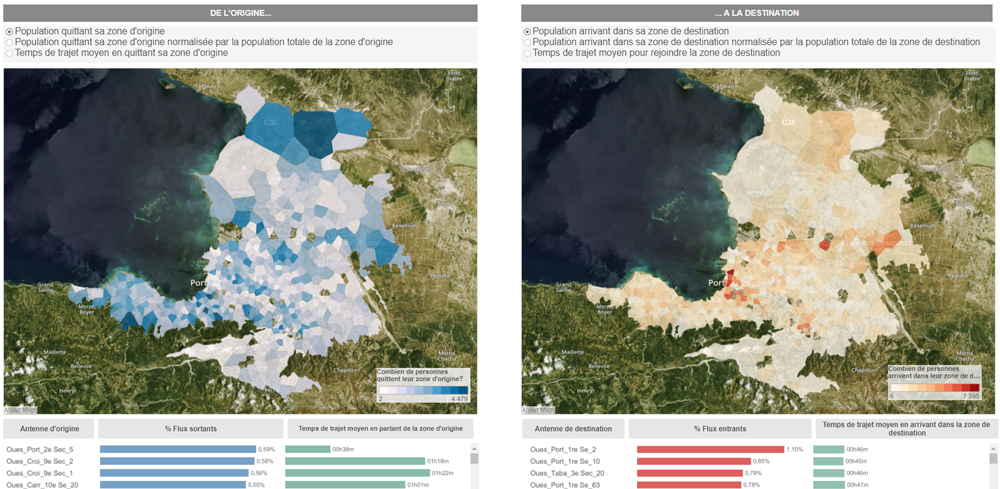
The above map, for example, illustrates the origin-destination flows in Port-
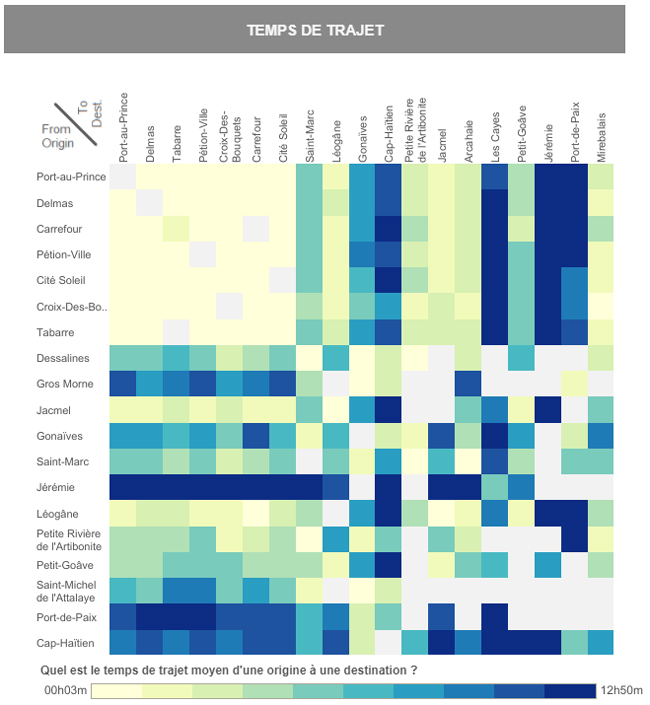
Below is a trip time matrix detailing the average commute time between Haiti’s most populous cities.
The Advantages of the Mobility Analytics Manager
Dalberg Data Insight’s innovative approach to mobility data unlocks the potential for intelligent city planning and urbanization. By providing accurate insights into the mobility patterns of a population, users of our Mobility Analytics Manager can more accurately make decisions about a city’s design in service of the population’s exact needs. In comparison to traditional data sources, the Mobility Analytics Manager has important advantages:
- The data is graphic, processed, and stabilized, giving more information to planners than they previously had
- Comprehensive and accurate, real-time, round-the-clock data, as opposed to a traditional field study, which usually only produces a seven hour snapshot into mobility patterns
- Our tools allow officials to interact with the data and visualize mobility flows across specific areas over time